Note
Go to the end to download the full example code.
Peaks Widgets Gallery
Some widgets are useful before sorting and works with the “peaks” given by the detect_peaks() function.
They are useful to check drift before running sorters.
import matplotlib.pyplot as plt

import spikeinterface.full as si
First, let’s download a simulated dataset from the repo ‘https://gin.g-node.org/NeuralEnsemble/ephy_testing_data’
local_path = si.download_dataset(remote_path="mearec/mearec_test_10s.h5")
rec, sorting = si.read_mearec(local_path)
Let’s filter and detect peaks on it
from spikeinterface.sortingcomponents.peak_detection import detect_peaks

rec_filtred = si.bandpass_filter(recording=rec, freq_min=300.0, freq_max=6000.0, margin_ms=5.0)
print(rec_filtred)
peaks = detect_peaks(
    recording=rec_filtred,
    method="locally_exclusive",
    peak_sign="neg",
    detect_threshold=6,
    exclude_sweep_ms=0.3,
    radius_um=100,
    noise_levels=None,
    random_chunk_kwargs={},
    chunk_memory="10M",
    n_jobs=1,
    progress_bar=True,
)
BandpassFilterRecording: 32 channels - 32.0kHz - 1 segments - 320,000 samples - 10.00s
                         float32 dtype - 39.06 MiB
/home/docs/checkouts/readthedocs.org/user_builds/spikeinterface/checkouts/3072/src/spikeinterface/core/job_tools.py:103: UserWarning: `n_jobs` is not set so parallel processing is disabled! To speed up computations, it is recommended to set n_jobs either globally (with the `spikeinterface.set_global_job_kwargs()` function) or locally (with the `n_jobs` argument). Use `spikeinterface.set_global_job_kwargs?` for more information about job_kwargs.
  warnings.warn(

noise_level:   0%|          | 0/20 [00:00<?, ?it/s]
noise_level:  15%|#5        | 3/20 [00:00<00:00, 24.96it/s]
noise_level:  30%|###       | 6/20 [00:00<00:00, 24.88it/s]
noise_level:  45%|####5     | 9/20 [00:00<00:00, 24.94it/s]
noise_level:  60%|######    | 12/20 [00:00<00:00, 24.88it/s]
noise_level:  75%|#######5  | 15/20 [00:00<00:00, 24.85it/s]
noise_level:  90%|######### | 18/20 [00:00<00:00, 24.87it/s]
noise_level: 100%|##########| 20/20 [00:00<00:00, 24.89it/s]

detect peaks using locally_exclusive:   0%|          | 0/5 [00:00<?, ?it/s]
detect peaks using locally_exclusive:  20%|##        | 1/5 [00:00<00:02,  1.58it/s]
detect peaks using locally_exclusive:  40%|####      | 2/5 [00:01<00:01,  1.61it/s]
detect peaks using locally_exclusive:  60%|######    | 3/5 [00:01<00:00,  2.50it/s]
detect peaks using locally_exclusive:  80%|########  | 4/5 [00:01<00:00,  3.37it/s]
detect peaks using locally_exclusive: 100%|##########| 5/5 [00:01<00:00,  3.25it/s]
peaks is a numpy 1D array with structured dtype that contains several fields:
print(peaks.dtype)
print(peaks.shape)
print(peaks.dtype.fields.keys())
[('sample_index', '<i8'), ('channel_index', '<i8'), ('amplitude', '<f8'), ('segment_index', '<i8')]
(749,)
dict_keys(['sample_index', 'channel_index', 'amplitude', 'segment_index'])
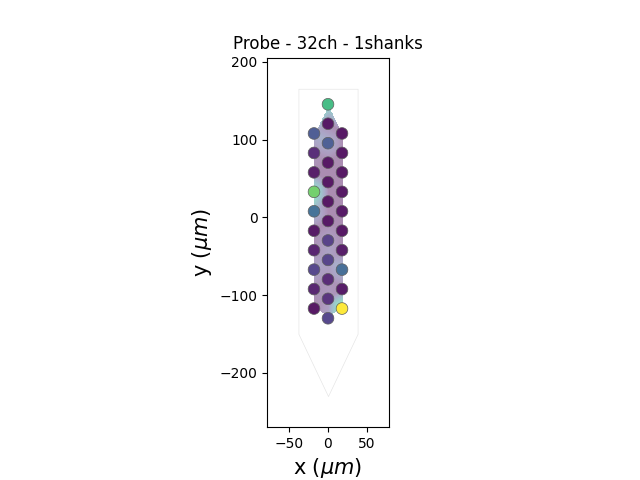
This “peaks” vector can be used in several widgets, for instance plot_peak_activity()
si.plot_peak_activity(recording=rec_filtred, peaks=peaks)

plt.show()
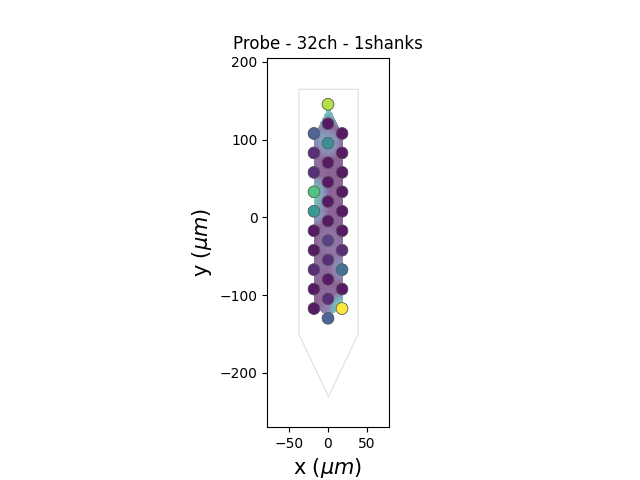
can be also animated with bin_duration_s=1.
si.plot_peak_activity(recording=rec_filtred, peaks=peaks, bin_duration_s=1.0)


plt.show()
Total running time of the script: (0 minutes 3.608 seconds)