Note
Go to the end to download the full example code.
Waveforms Widgets Gallery
Here is a gallery of all the available widgets using a pair of RecordingExtractor-SortingExtractor objects.
import matplotlib.pyplot as plt

import spikeinterface as si
import spikeinterface.extractors as se
import spikeinterface.postprocessing as spost
import spikeinterface.widgets as sw
- First, let’s download a simulated dataset
from the repo ‘https://gin.g-node.org/NeuralEnsemble/ephy_testing_data’
local_path = si.download_dataset(remote_path="mearec/mearec_test_10s.h5")
recording, sorting = se.read_mearec(local_path)
print(recording)
print(sorting)
MEArecRecordingExtractor: 32 channels - 32.0kHz - 1 segments - 320,000 samples - 10.00s
                          float32 dtype - 39.06 MiB
  file_path: /home/docs/spikeinterface_datasets/ephy_testing_data/mearec/mearec_test_10s.h5
MEArecSortingExtractor: 10 units - 1 segments - 32.0kHz
  file_path: /home/docs/spikeinterface_datasets/ephy_testing_data/mearec/mearec_test_10s.h5
Extract spike waveforms
For convenience, metrics are computed on the SortingAnalyzer object that gathers recording/sorting and the extracted waveforms in a single object
analyzer = si.create_sorting_analyzer(sorting=sorting, recording=recording, format="memory")
# core extensions
analyzer.compute(["random_spikes", "waveforms", "templates", "noise_levels"])

# more extensions
analyzer.compute(["spike_amplitudes", "unit_locations", "spike_locations", "template_metrics"])
/home/docs/checkouts/readthedocs.org/user_builds/spikeinterface/checkouts/3072/src/spikeinterface/core/job_tools.py:103: UserWarning: `n_jobs` is not set so parallel processing is disabled! To speed up computations, it is recommended to set n_jobs either globally (with the `spikeinterface.set_global_job_kwargs()` function) or locally (with the `n_jobs` argument). Use `spikeinterface.set_global_job_kwargs?` for more information about job_kwargs.
  warnings.warn(

estimate_sparsity:   0%|          | 0/10 [00:00<?, ?it/s]
estimate_sparsity: 100%|##########| 10/10 [00:00<00:00, 710.98it/s]

compute_waveforms:   0%|          | 0/10 [00:00<?, ?it/s]
compute_waveforms: 100%|##########| 10/10 [00:00<00:00, 215.16it/s]

noise_level:   0%|          | 0/20 [00:00<?, ?it/s]
noise_level:  20%|##        | 4/20 [00:00<00:00, 39.26it/s]
noise_level:  40%|####      | 8/20 [00:00<00:00, 38.96it/s]
noise_level:  60%|######    | 12/20 [00:00<00:00, 38.82it/s]
noise_level:  80%|########  | 16/20 [00:00<00:00, 38.83it/s]
noise_level: 100%|##########| 20/20 [00:00<00:00, 38.83it/s]
noise_level: 100%|##########| 20/20 [00:00<00:00, 38.84it/s]
/home/docs/checkouts/readthedocs.org/user_builds/spikeinterface/checkouts/3072/src/spikeinterface/core/job_tools.py:103: UserWarning: `n_jobs` is not set so parallel processing is disabled! To speed up computations, it is recommended to set n_jobs either globally (with the `spikeinterface.set_global_job_kwargs()` function) or locally (with the `n_jobs` argument). Use `spikeinterface.set_global_job_kwargs?` for more information about job_kwargs.
  warnings.warn(

Compute : spike_amplitudes + spike_locations:   0%|          | 0/10 [00:00<?, ?it/s]
Compute : spike_amplitudes + spike_locations: 100%|##########| 10/10 [00:00<00:00, 112.13it/s]
plot_unit_waveforms()
unit_ids = sorting.unit_ids[:4]

sw.plot_unit_waveforms(analyzer, unit_ids=unit_ids, figsize=(16, 4))
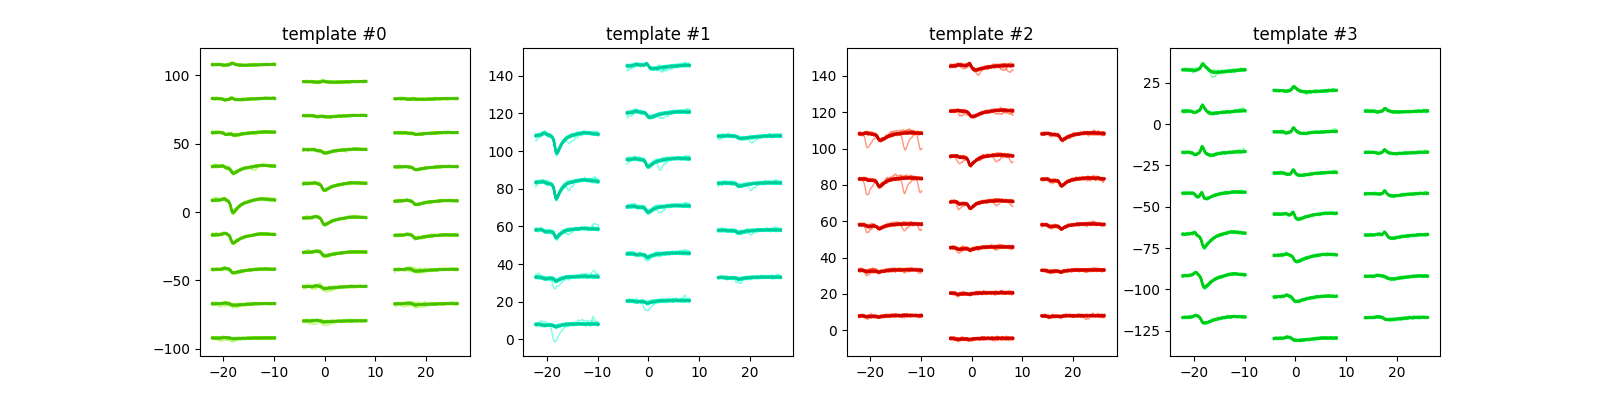
<spikeinterface.widgets.unit_waveforms.UnitWaveformsWidget object at 0x7f496ffa4100>
plot_unit_templates()
unit_ids = sorting.unit_ids

sw.plot_unit_templates(analyzer, unit_ids=unit_ids, ncols=5, figsize=(16, 8))
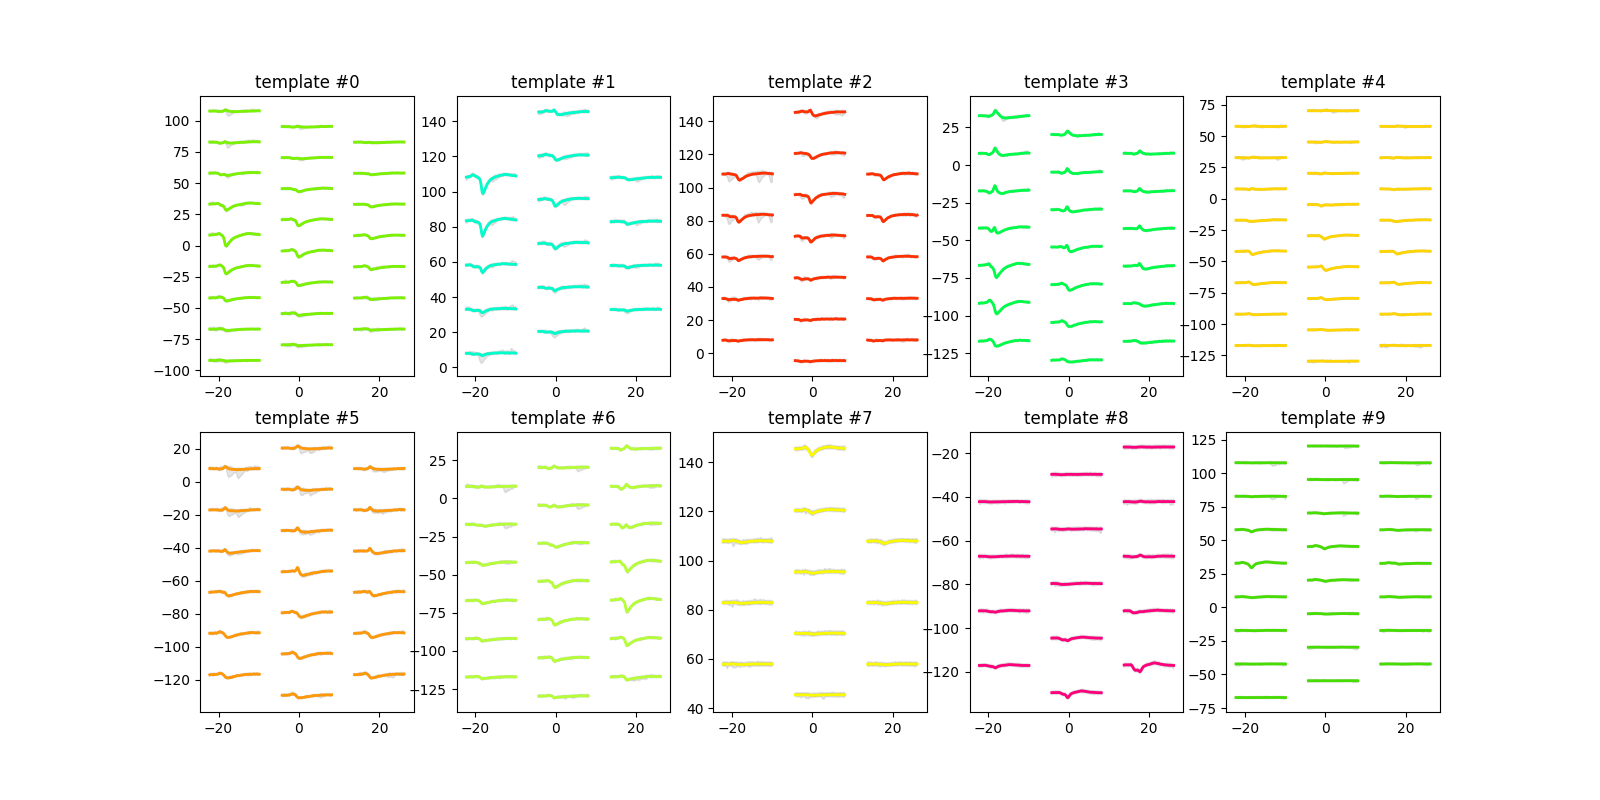
<spikeinterface.widgets.unit_templates.UnitTemplatesWidget object at 0x7f496ffa71f0>
plot_amplitudes()
sw.plot_amplitudes(analyzer, plot_histograms=True, figsize=(12, 8))
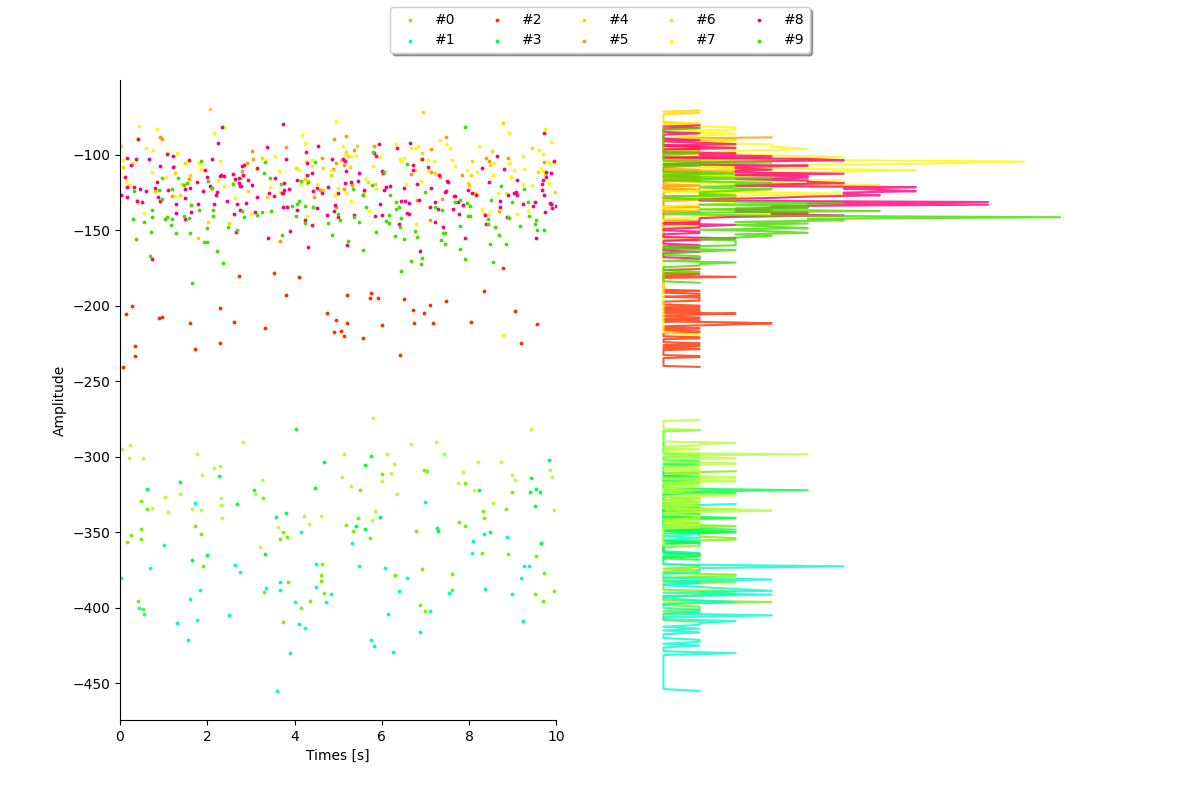
<spikeinterface.widgets.amplitudes.AmplitudesWidget object at 0x7f496ffa6e90>
plot_unit_locations()
sw.plot_unit_locations(analyzer, figsize=(4, 8))
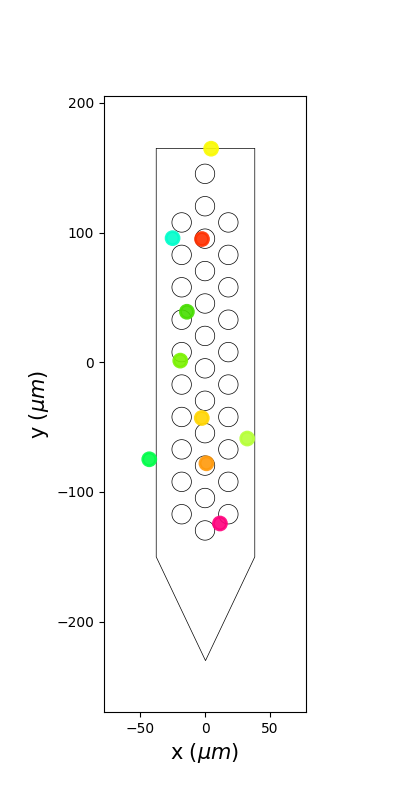
<spikeinterface.widgets.unit_locations.UnitLocationsWidget object at 0x7f496ffa6c20>
plot_unit_waveform_density_map()
This is your best friend to check for overmerge
unit_ids = sorting.unit_ids[:4]
sw.plot_unit_waveforms_density_map(analyzer, unit_ids=unit_ids, figsize=(14, 8))
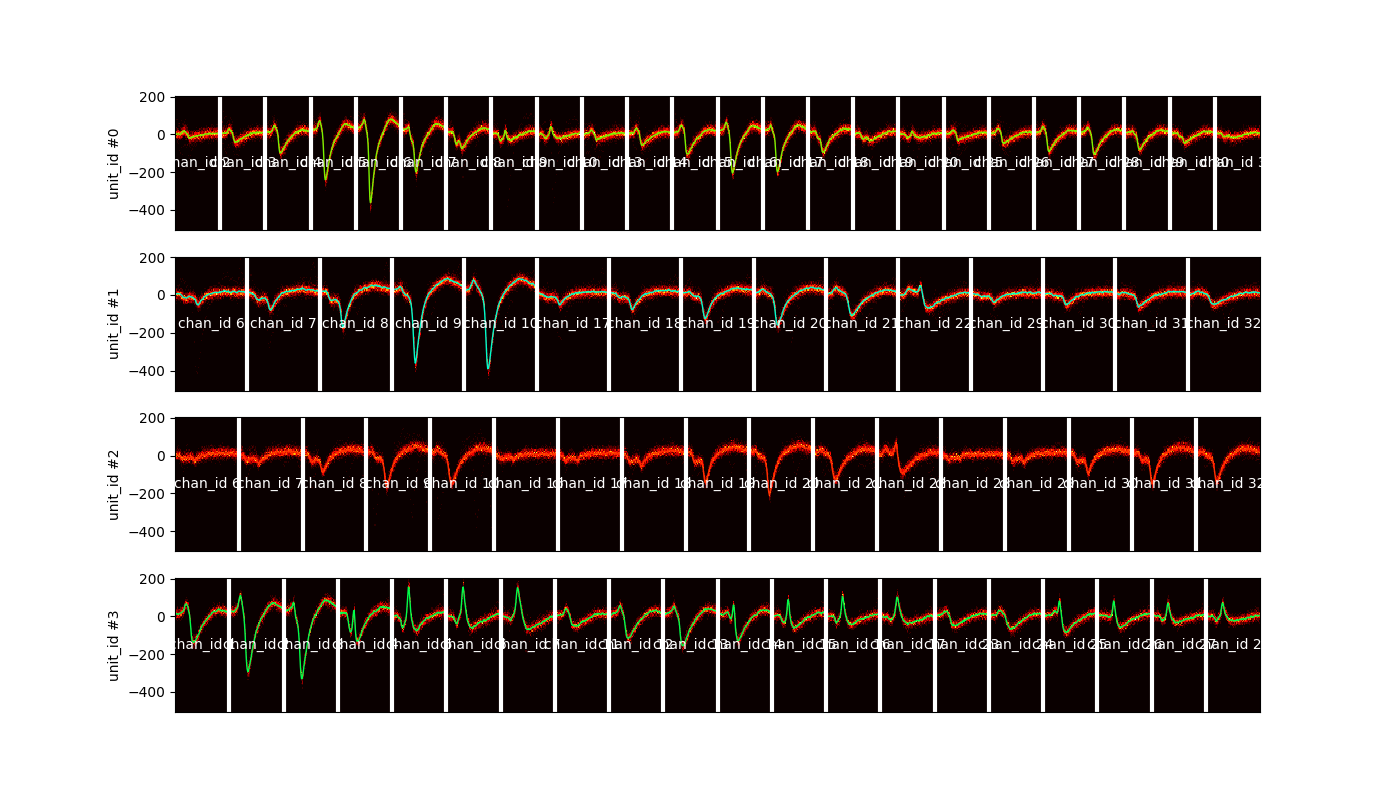
<spikeinterface.widgets.unit_waveforms_density_map.UnitWaveformDensityMapWidget object at 0x7f4982167fa0>
plot_amplitudes_distribution()
sw.plot_all_amplitudes_distributions(analyzer, figsize=(10, 10))
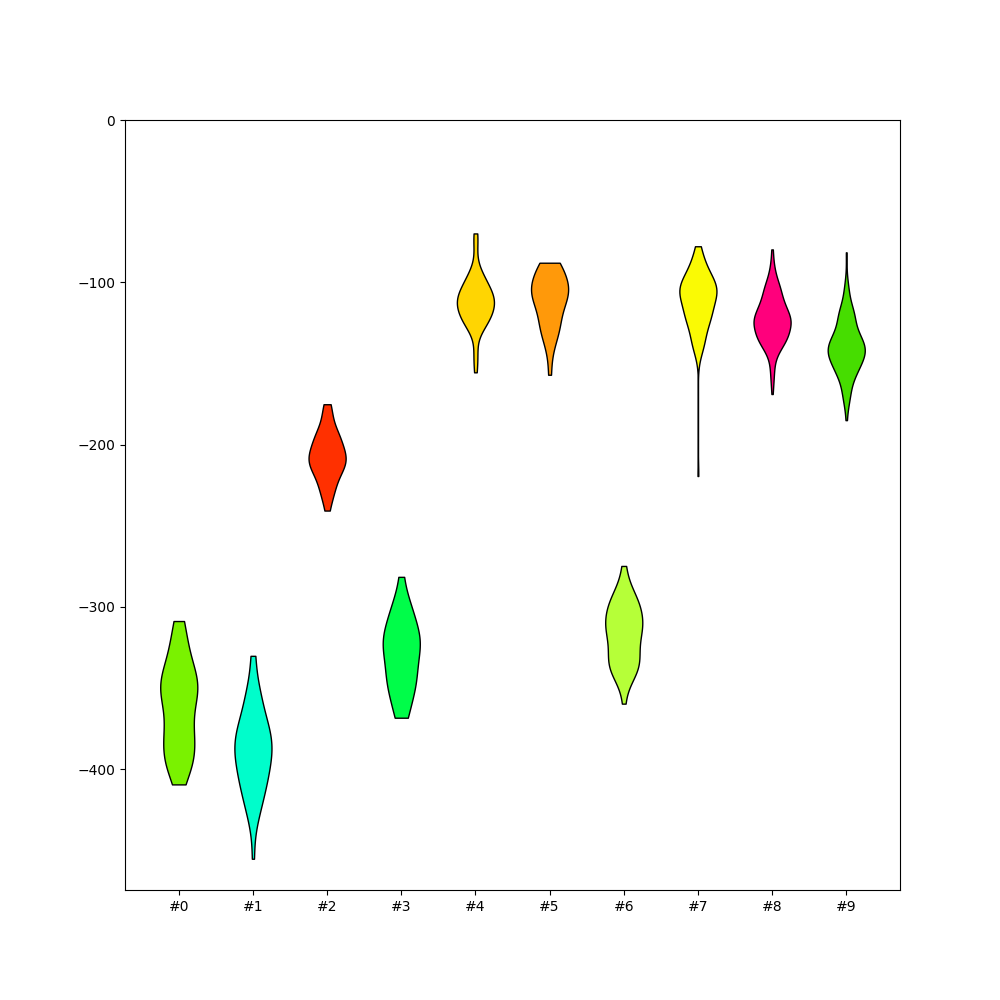
<spikeinterface.widgets.all_amplitudes_distributions.AllAmplitudesDistributionsWidget object at 0x7f4982165660>
plot_units_depths()
sw.plot_unit_depths(analyzer, figsize=(10, 10))
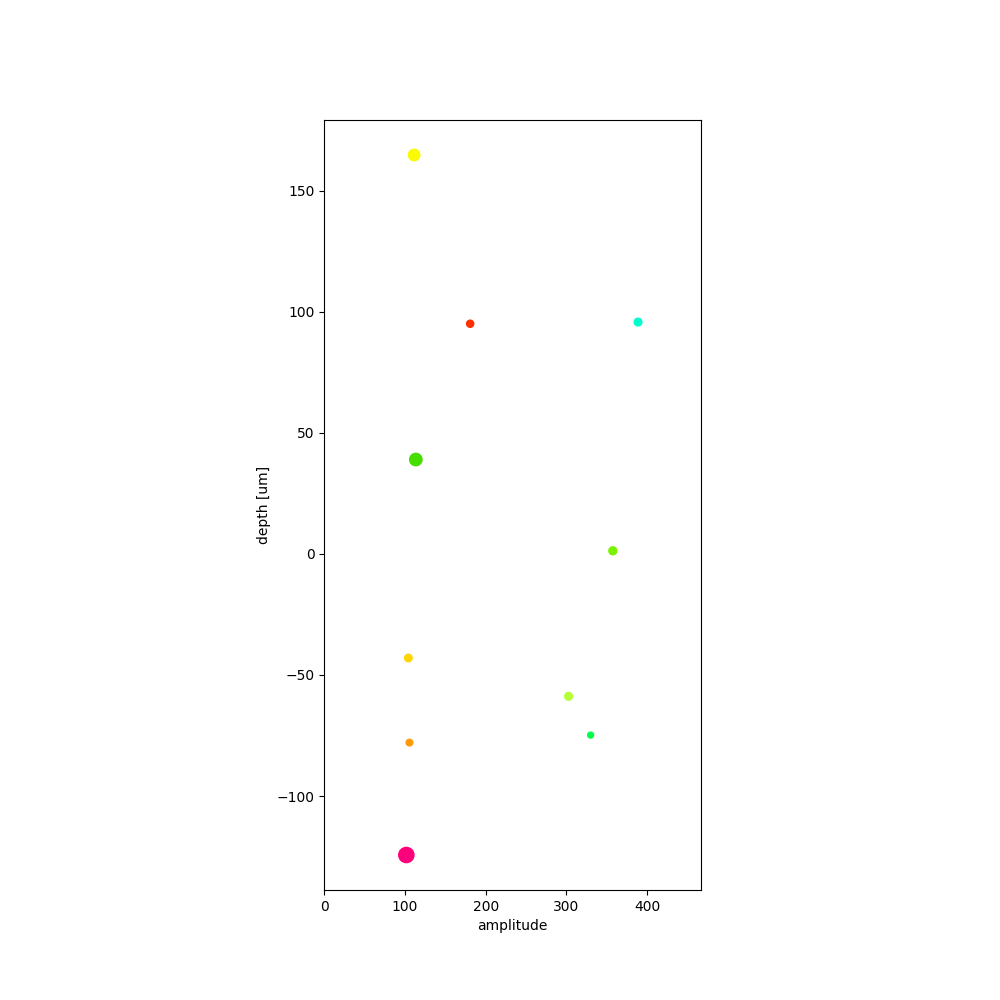
<spikeinterface.widgets.unit_depths.UnitDepthsWidget object at 0x7f498204b880>
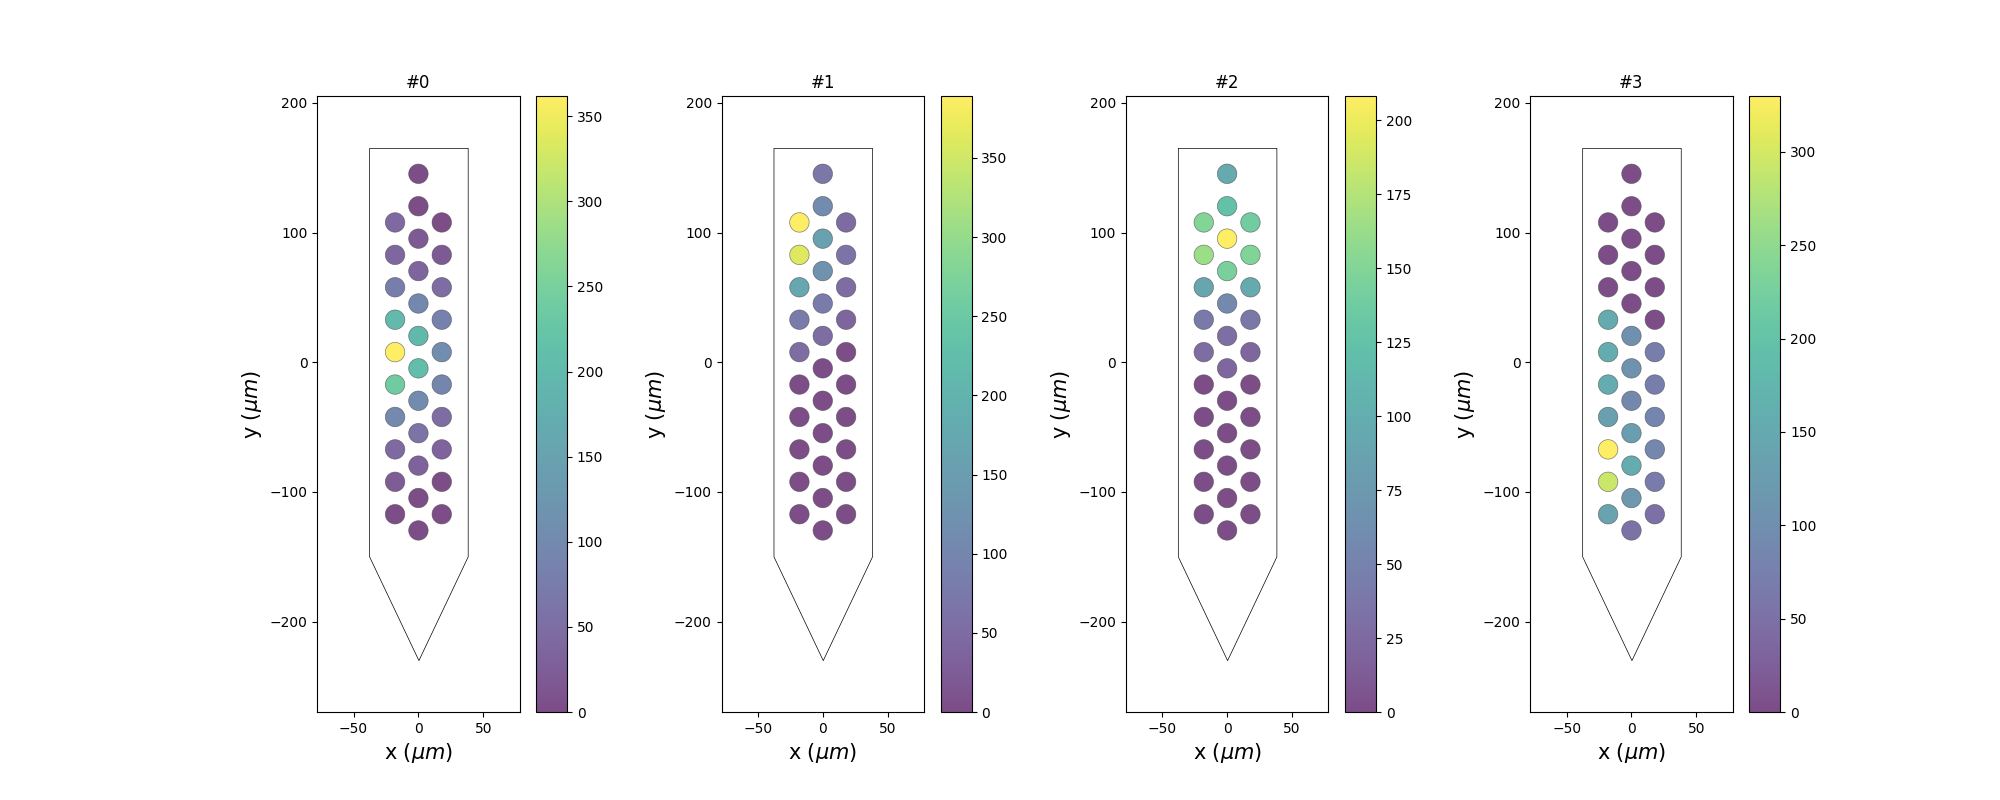
plot_unit_probe_map()
unit_ids = sorting.unit_ids[:4]
sw.plot_unit_probe_map(analyzer, unit_ids=unit_ids, figsize=(20, 8))


plt.show()
Total running time of the script: (0 minutes 6.613 seconds)