Note
Go to the end to download the full example code.
SortingExtractor Widgets Gallery
Here is a gallery of all the available widgets using SortingExtractor objects.
import matplotlib.pyplot as plt

import spikeinterface.extractors as se
import spikeinterface.widgets as sw
First, let’s create a toy example with the extractors module:
recording, sorting = se.toy_example(duration=100, num_channels=1, seed=0, num_segments=1)
/home/docs/checkouts/readthedocs.org/user_builds/spikeinterface/checkouts/3072/src/spikeinterface/core/generate.py:2255: UserWarning: generate_unit_locations(): no solution for minimum_distance=20.0 and max_iteration=100
  warnings.warn(f"generate_unit_locations(): no solution for {minimum_distance=} and {max_iteration=}")
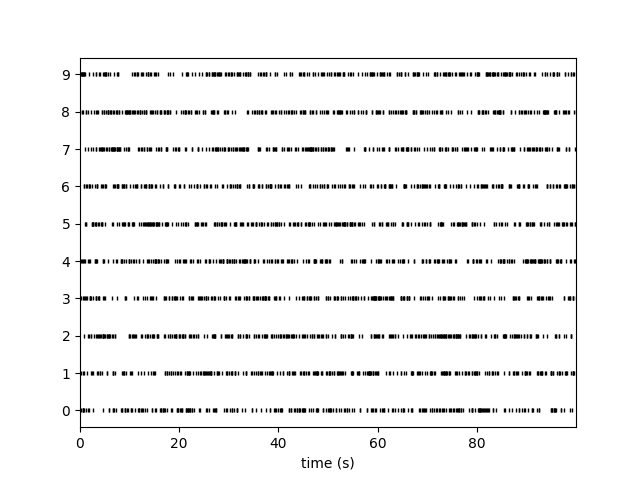
plot_rasters()
w_rs = sw.plot_rasters(sorting)
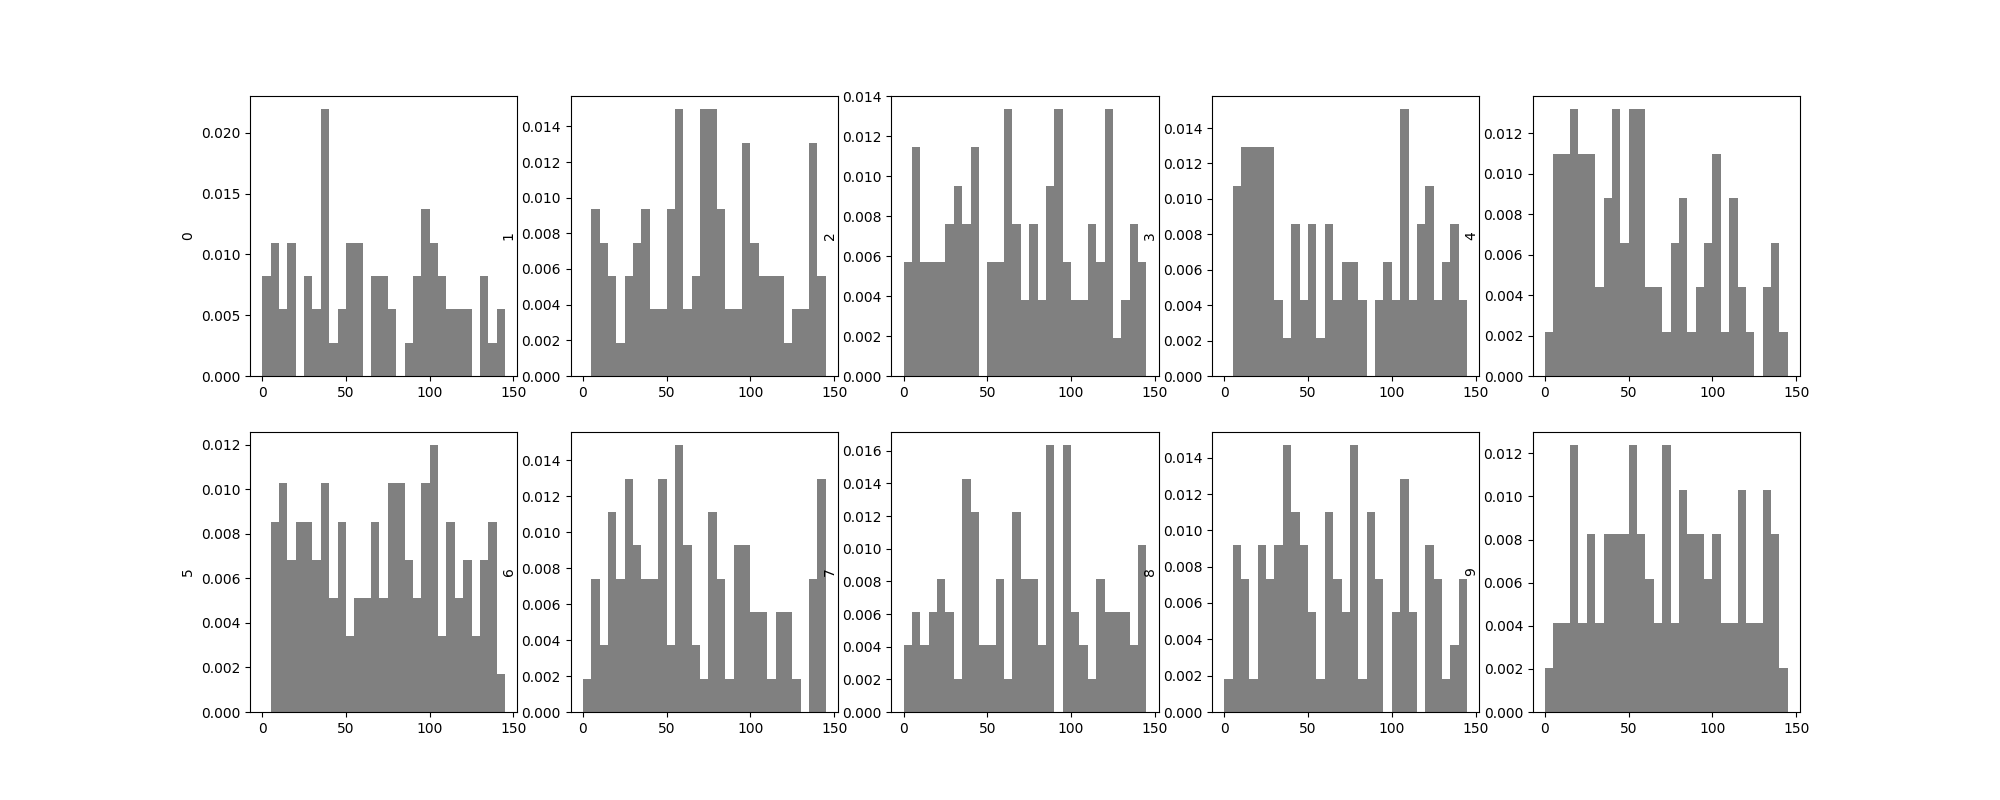
plot_isi_distribution()
w_isi = sw.plot_isi_distribution(sorting, window_ms=150.0, bin_ms=5.0, figsize=(20, 8))
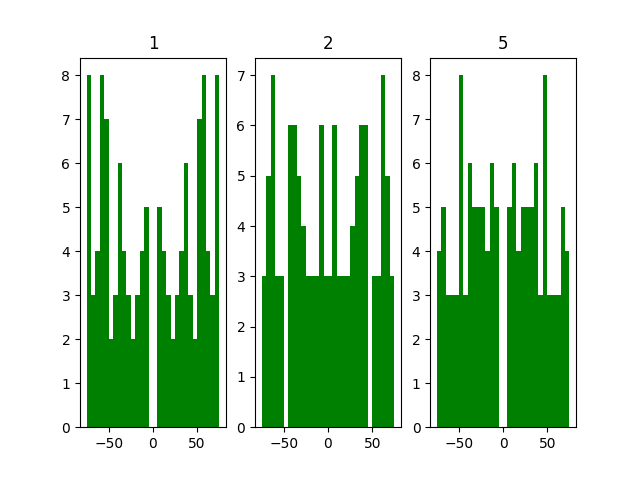
plot_autocorrelograms()
w_ach = sw.plot_autocorrelograms(sorting, window_ms=150.0, bin_ms=5.0, unit_ids=[1, 2, 5])
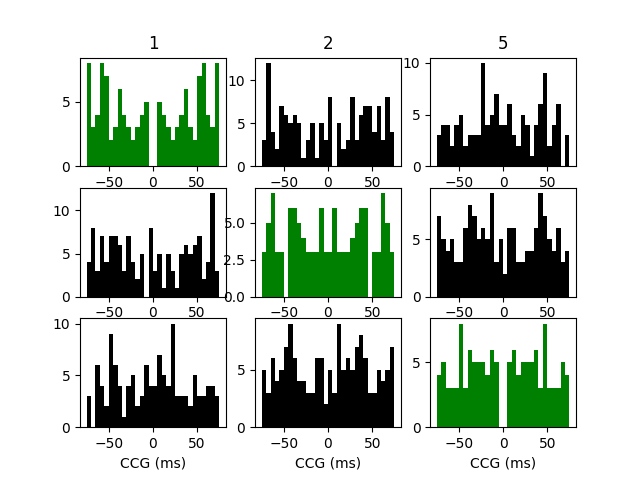
plot_crosscorrelograms()
w_cch = sw.plot_crosscorrelograms(sorting, window_ms=150.0, bin_ms=5.0, unit_ids=[1, 2, 5])

plt.show()
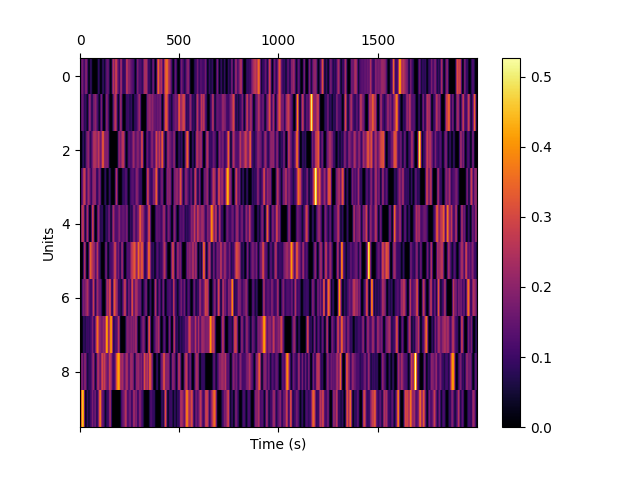
plot_unit_presence()
w_pr = sw.plot_unit_presence(sorting)

plt.show()
Total running time of the script: (0 minutes 3.653 seconds)